
You can effectively overlay property lines, parcel data, and coordinates on one map to enhance your understanding of land boundaries and ownership. By utilizing mapping software and geographic information system (GIS) tools, you can combine various data layers for a comprehensive view. This process allows you to visualize the relationships between different properties, assess land use, and make informed decisions regarding development or investment. In this guide, you will learn the key steps and tools necessary to create an informative and accurate map overlay.
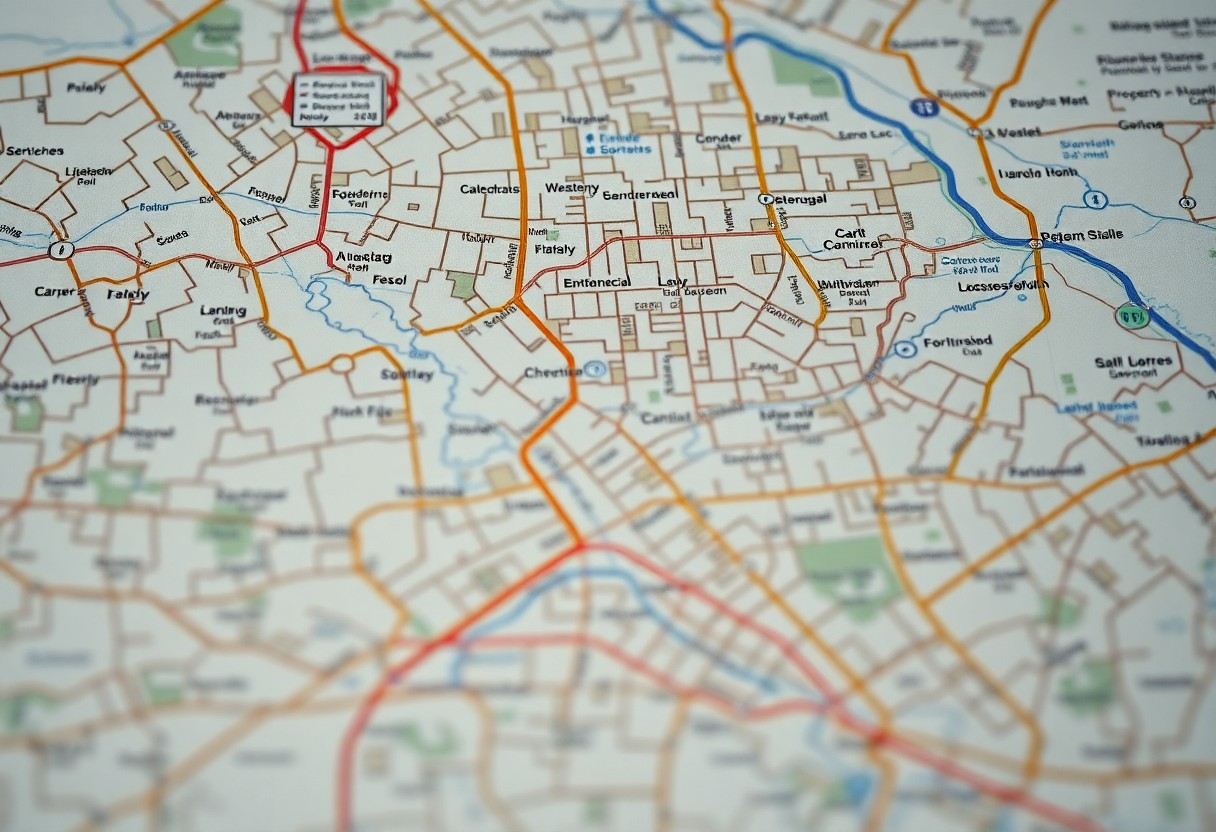
The Art of Cartographic Layering
Mastering the art of cartographic layering allows you to create maps that convey complex information clearly and effectively. By visually arranging different data sets, you enhance your map’s interpretability, revealing relationships and patterns that might otherwise go unnoticed. This layering technique is pivotal in urban planning, environmental studies, and real estate, aiding in informed decision-making and communication amongst diverse stakeholders.
What is Cartographic Overlay?
Cartographic overlay involves superimposing multiple data layers on a single map to create a comprehensive visual representation. Each layer can represent different data types, such as property lines, geographic features, or demographic information. This technique helps you analyze spatial relationships and draw insights more effectively than standalone maps.
Tools and Software for Layering Maps
You have a variety of tools and software at your disposal for effective map layering. Popular GIS (Geographic Information System) platforms like ArcGIS and QGIS allow you to import various data sources and layer them seamlessly. Online applications such as Google Earth and Mapbox also offer user-friendly interfaces for layering maps without extensive technical skills.
ArcGIS provides robust features for professionals, enabling intricate analyses with extensive datasets, while QGIS, being open-source, caters to budget-conscious users yet remains powerful. For web-based layering, Google Earth’s intuitive interface allows you to visualize data in real-time, making it accessible for non-experts. Mapbox combines customizable map designs with real-time data integration, offering flexibility for developers. Each tool serves different user needs, facilitating various layers of data, which enhances your mapping capabilities.
Sourcing Property Line Data Effectively
Effective sourcing of property line data begins with identifying reliable and accurate datasets. National, state, and local government agencies often provide publicly accessible resources such as county assessor websites or GIS databases. You may also consider using commercial databases that specialize in real estate information, as they often offer enhanced features like historical data and visualization tools. Subscription services like CoreLogic or Zillow can also provide valuable insights regarding boundary lines and property ownership.
Identifying Official Data Sources
Official data sources are typically found through local government offices, including county clerk, land registry, and appraisal districts. Your county’s GIS department may also maintain mapping services that detail property lines, taxation parcels, and relevant surveys. Checking the Federal Geographic Data Committee (FGDC) can lead you to further resources, as it offers national datasets that can be foundational for your mapping projects.
Navigating Zoning and Land Use Regulations
Understanding zoning and land use regulations is crucial for correctly interpreting property data. Each municipality enforces specific zoning laws that dictate how land can be used, affecting everything from commercial development to residential construction. You’ll find that this information can often be located on your local planning department’s website, where zoning maps, land use plans, and related documents outline permissible uses for each parcel.
To navigate these regulations effectively, familiarize yourself with key zoning designations such as residential, commercial, industrial, or mixed-use. For example, a property within a residential zone may allow only single-family homes, while a commercial zone may accommodate retail or office space. Understanding overlay zones or special use permits can be just as vital, as they might allow for exceptions or additional regulations influencing your development plans. Being proactive in engaging with local planning meetings or contacting zoning officials can clarify these complexities and ensure compliance with all relevant regulations.
Accurately Integrating Parcel Data
Correctly integrating parcel data requires precise alignment of property boundaries with reliable geographical references. You’ll need access to accurate datasets, such as tax maps and property deeds, to ensure your overlays reflect true ownership and property lines. By utilizing software tools designed for this purpose, you can achieve a seamless blend of parcel data, resulting in effective visualizations that aid in informed decision-making.
Understanding Parcel Boundaries and Ownership
Parcel boundaries define the limits of land ownership and are necessary for property management and transactions. Understanding these boundaries involves consulting local property records and tax maps to verify dimensions and ownership details. This information not only helps clarify rights and responsibilities but also aids in conflict resolution between neighboring property owners.
Utilizing GIS Technology for Parcel Analysis
GIS technology streamlines the analysis of parcel data by providing tools for detailed mapping and spatial analysis. Through GIS, you can overlay various datasets, conduct geographic assessments, and visualize property attributes in a way that traditional methods cannot. This enables enhanced understanding of land use patterns and zoning, facilitating more strategic planning and investment decisions.
Many GIS platforms, like ArcGIS and QGIS, offer advanced functionalities such as 3D modeling and demographic analysis, which allow you to explore how parcel boundaries interact with surrounding environments. For example, integrating demographic data can reveal trends in property values or potential development hotspots. This capability empowers you to not only visualize current parcel conditions but also forecast future changes in land use, thereby supporting proactive decision-making for urban planning or real estate investment strategies.
Mapping Coordinates with Precision
Achieving pinpoint accuracy in mapping coordinates is necessary for overlaying property lines and parsing parcel data effectively. This process ensures that your visuals align perfectly with the real-world geography, eliminating discrepancies that could lead to misinterpretations or regulatory issues. Using advanced mapping tools can automate much of this precision, helping you focus on data insights rather than manual adjustments.
The Importance of Coordinate Systems
Coordinate systems serve as the backbone of cartography, providing a standardized framework for defining locations on the Earth’s surface. A well-defined coordinate system allows you to accurately relate your parcel data with other geospatial information. By adhering to recognized systems like Latitude/Longitude or UTM, you enhance the interoperability of your data with various mapping applications.
Techniques for Accurate Coordinate Placement
Employing specific techniques can significantly improve the accuracy of your coordinate placements. Using GIS software enables you to import spatial data seamlessly, ensuring precise alignment with property lines. Additionally, leveraging GPS technology provides real-time, location-specific data that can corroborate your existing datasets. Using georeferencing methods also helps align your digitized maps with real-world coordinates for better alignment.
Several tactics enhance the accuracy of coordinate placement in your mapping tasks. First, adopt a high-quality GPS device for real-time updates, especially in field surveys. Integrate GIS software with notable layers of spatial data to create a comprehensive view, enabling you to cross-reference information easily. Utilizing tools like buffer zones around your coordinates can also assist in accommodating slight discrepancies, ensuring your mapped data reflects on-the-ground realities. Regular calibration of your equipment will further optimize the precision of your placements, enabling you to produce trustworthy maps.
Visualizing Overlay with Clarity
Clarity in visualization ensures that all relevant data layers are comprehensible and actionable. You achieve this by using contrasting colors, consistent symbols, and clear labels that differentiate property lines, parcel data, and coordinates effectively. Additionally, incorporating transparent overlays allows underlying data to remain visible, providing context without overwhelming the viewer. Pay attention to details like scale and legend accuracy, which enhance usability and understanding of the map.
Design Principles for Effective Map Presentation
Effective map presentation hinges on several key design principles. You should prioritize simplicity, ensuring that each layer adds value without clutter. Use a hierarchy of information: major features should stand out while secondary details support without competing for attention. The use of white space can also prevent confusion, guiding the eye to important data points. Furthermore, consistent font styles and sizes across the map enhance readability and user ease.
Innovations in Map Visualization Technologies
Recent advancements in map visualization technologies have transformed the way you interpret and interact with geographical data. Tools such as 3D mapping software and augmented reality applications provide immersive experiences, letting you visualize complex data in accessible formats. Machine learning algorithms also analyze vast datasets, identifying patterns and correlations that might go unnoticed. Real-time data integration allows for dynamic updates, ensuring your maps reflect current conditions and trends.
For example, platforms like ArcGIS Pro and QGIS now offer advanced functionalities like 3D visualization and interactive web maps that adapt to user inputs. Innovations like these facilitate engaging storytelling through data, making it easier for you to present insights to stakeholders or clients. Enhanced tools for integration, such as APIs, allow seamless incorporation of satellite imagery, topography, and demographic data, enriching your overlays. This technological evolution not only democratizes access to mapping capabilities but also enhances decision-making in real estate and land management.
Conclusion
From above, you can effectively overlay property lines, parcel data, and coordinates on one map by utilizing GIS software or mapping applications. Start by importing your property data, then adjust layers for optimal visibility. Use precise geocoding to align coordinates accurately and take advantage of tools that allow you to customize the map view. This integrated approach provides you with a comprehensive visual representation of your land, enhancing your analysis and decision-making capabilities.